In preparation for the next phase of my further studies, I have just spent a few weeks spinning up my Zettelkasten note taking system using Obsidian.
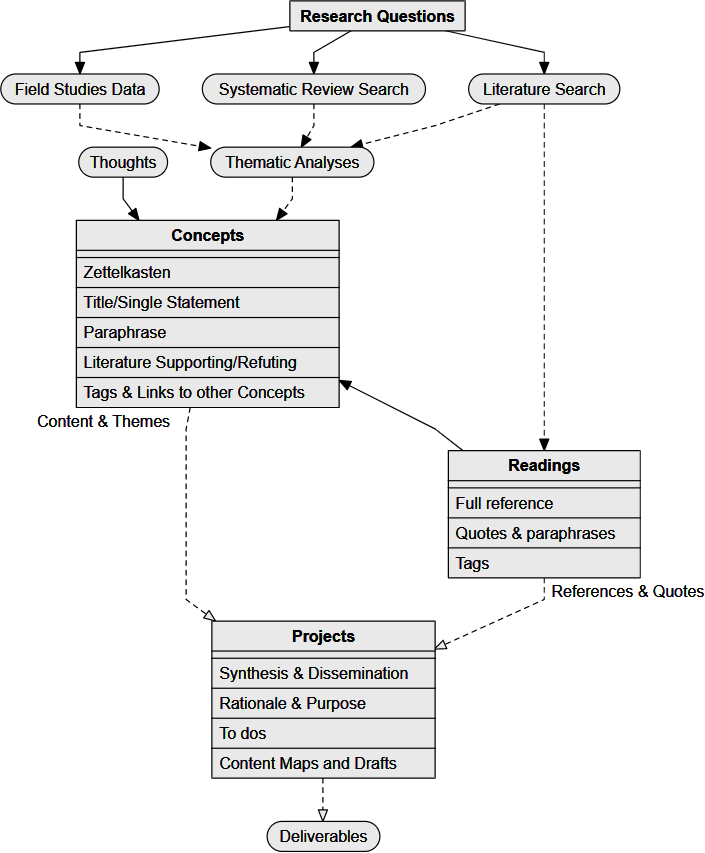
The diagram above shows how I plan to get data into, and synthesise material out of, my knowledge management system (KMS). Everything I read and think about will be captured as individual concepts. These will then be linked to other concepts, to enable a structure (made up of interrelationships) to emerge over time. Out of this structure will come themes and insights that feed into the deliverables for dissemination.
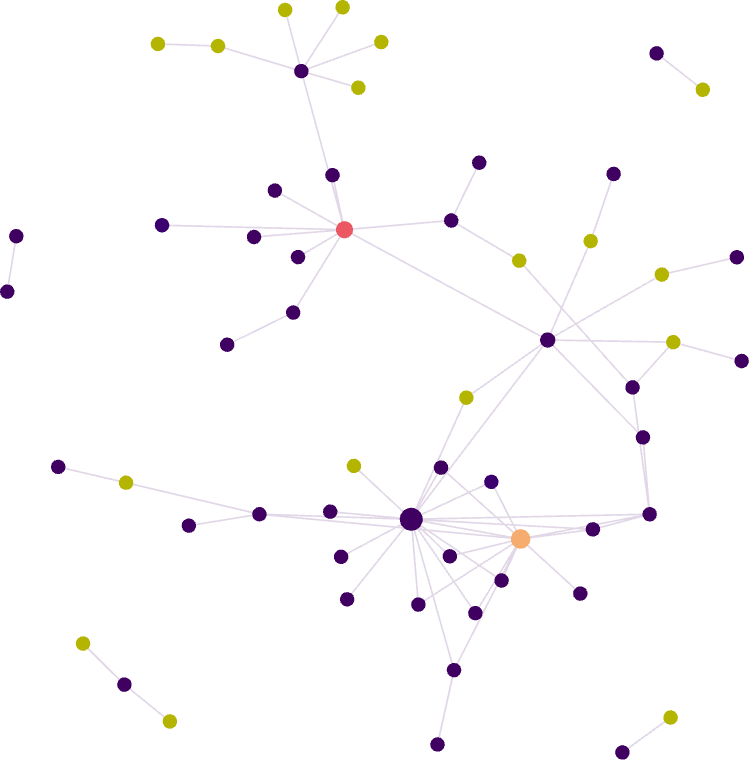
Obsidian provides a cool way to visualise the connections between concepts, as shown below.
My expectation is to grow my system to something like the example below.
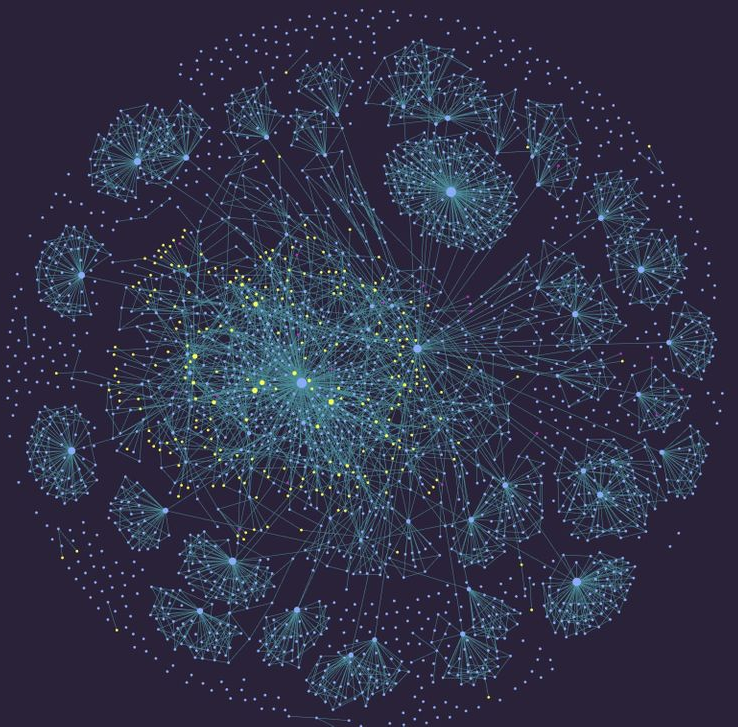
From chrisbowler.com