A 3D graph can be deliberately subverted to skew the perception of the information it contains. By simply increasing the perspective, you can give artificial emphasis to a particular slice of the chart, to make that slice appear larger as it were.
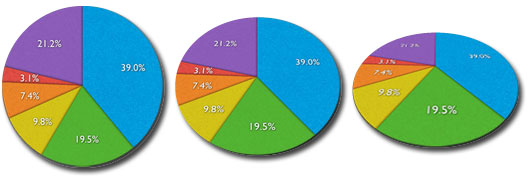
Note how very different the perception of the size of the green slice is relative to the other slices on each of the charts above. All three charts have identical slices and percentages. The left most one is flat (no perspective). The other two have different amounts of perspective applied.
Graphs like the ones above provide a quick way to visually communicate relative importance. As most of us are dominantly visual learners, we will subtly note the visual relationships first before we get to the numbers, if we even get to the numbers.
This just goes to show, when attempting to presenting information accurately, less is more. For most graphs, 3D effects serve no useful communications function. Unless you deliberately use it to distort the information you are presenting.
This post was triggered by Jack Schofield’s post on the Guardian on a presentation by Apple’s Steve Jobs. I used the 2D graph by Charles Arthur to illustrate this post.